
建構 Grafana + Influxdb v2.0 + Telegraf 監控系統(docker版)
經驗談
使用過許多 Dashboard 的軟件,而 Grafana 則是非常適合用來做監控,簡單易設又能結合多種來源與告警,但在公司時,都是使用同事架好的 Grafana,初步知道是使用 Influxdb 與 Telegraf 來儲存與收集資料,所以接下來我也來架看看嘍!
作業環境
- Ubuntu 20.04.3 LTS
- Windows 10 專業版
- Docker version 20.10.9
- Grafana v8.2.1
- Influxdb v2.0.9
- Telegraf v1.20.2
安裝 Grafana + Influxdb v2.0 + Telegraf
安裝 Grafana v8.2.1
首先查詢官方提供的 docker image,指令為
$ docker search grafana
一般第一個就是官方提供的 Image 檔,結果如下。
$ docker search grafana
NAME                  DESCRIPTION                                     STARS     OFFICIAL   AUTOMATED
grafana/grafana       The official Grafana docker container           1999
所以我們要下載的 image 檔名是 grafana/grafana,那就來建立 Grafana 的 container 嘍!為了預防 Grafana 的資料因重建 Container 而遺失,所以我們先建立 docker volume ,指令如下
# create a persistent volume for your data in /var/lib/grafana (database and plugins)
$ docker volume create grafana-storage

# start grafana
$ docker run -d --name=grafana -v grafana-storage:/var/lib/grafana -p 3030:3000 grafana/grafana
如果沒有下載過,就會執行下載,狀態是 Status: Downloaded newer image for grafana/grafana:latest。如果已下載,則狀態是 Status: Image is up to date for grafana/grafana:latest。
Note: 這裡為什麼我的本機會用 3030 port,而不是用 3000 port,是因為 BI 工具的 metabase 預設也是 3000,所以 Grafana 就另外指定 port 嘍!
檢查一下剛建的 container 是否有成功啟動,檢查語法如下。
$ docker ps -a
這時我們可以看到結果如下。
$ docker ps -a
CONTAINER ID   IMAGE                    COMMAND        CREATED         STATUS         PORTS                                                                                  NAMES
69f2cc7919a8   grafana/grafana          "/run.sh"      9 minutes ago   Up 9 minutes   0.0.0.0:3030->3000/tcp, :::3030->3000/tcp                                              grafana
狀態是 Up 的,即可開啟瀏覽器連進 Grafana 的入口頁面了,連結為 http://IP:3030,例如我剛才安裝的主機 IP 是 192.168.1.105,所以輸入 http://192.168.1.105:3030 即可。
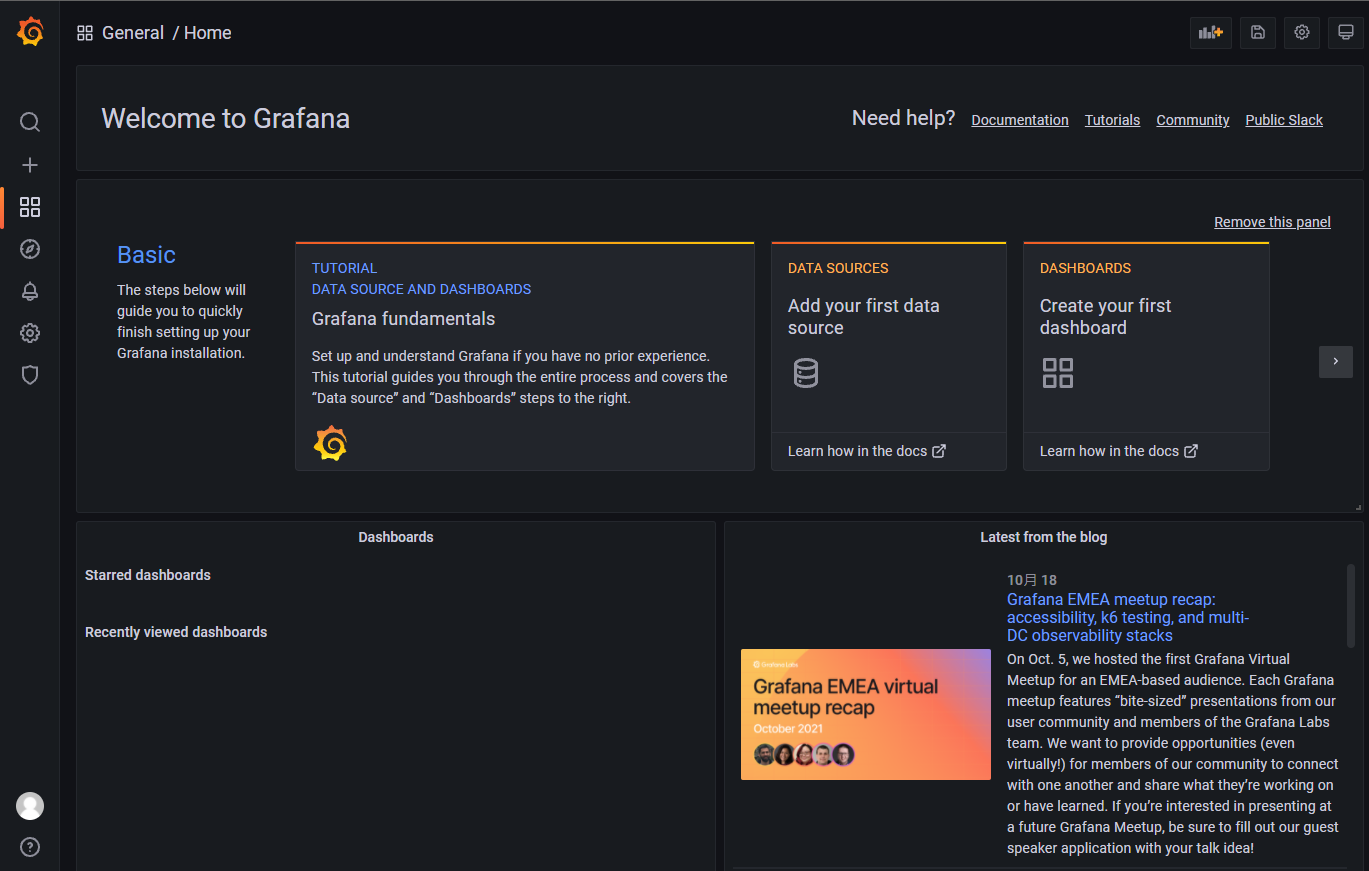
第一次登入的預設帳密是 admin / admin,登入後會要求重新設定密碼,重設之後就可以進入如下圖的畫面了。
安裝 Influxdb v2.0.9
Influxdb 是一個開源的時序型資料庫,用來存放 Telegraf 收集的資料,用 Grafana 來做圖表的呈現。這時取得 Influxdb 的 docker image 已是 2.0.9 版了,跟 1.x 版有了一些參數的不同,接下來安裝 Influxdb 吧。
首先建立 volumn,避免 Container 重做時的資料與設定遺失,指令如下。
$ docker volume create influxdb-storage
$ docker volume create influxdb-config
如欲知道其它可參考Influxdb Official Image (Docker Hub)。
另外,我打算讓 influxdb 與 telegraf 在同一個網段,所以建立一個 network 就命名為 influxdb,指令如下。
$ docker network create influxdb
安裝 influxdb 的指令如下。
$ docker run -d --name=influxdb2 -p 8086:8086 \
      --net=influxdb \
      --hostname=influxdb \
      -v influxdb-storage:/var/lib/influxdb2 \
      -v influxdb-config:/etc/influxdb2 \
      -e DOCKER_INFLUXDB_INIT_MODE=setup \
      -e DOCKER_INFLUXDB_INIT_USERNAME=dsaadmin \
      -e DOCKER_INFLUXDB_INIT_PASSWORD=dsaadmin \
      -e DOCKER_INFLUXDB_INIT_ORG=dsalearning \
      -e DOCKER_INFLUXDB_INIT_BUCKET=dsa-bucket \
      influxdb:latest
上述指令中的 USERNAME、PASSWORD、ORG、BUCKET 可以改成你自訂的, container 只要有建立成功,都會得到像下方的結果。
cdf59b175f58a3cfb904a5f7aa2cf5a652a7af8f6691759eb1f325fbd823e82b
本人在這重建了幾次,主要是 Influxdb 1.x 與 Influxdb 2.0 有不小的差異,在 telegraf.conf 的設定有些不同,所以 container id 會跟下述的範例不同。
查看 Container 是否有成功啟動
$ docker ps -a
CONTAINER ID   IMAGE                    COMMAND                  CREATED          STATUS          PORTS                                                                                  NAMES
57f802619081   influxdb:latest          "/entrypoint.sh infl…"   38 minutes ago   Up 38 minutes   0.0.0.0:8086->8086/tcp, :::8086->8086/tcp                                              influxdb2
736014d092d0   grafana/grafana          "/run.sh"                24 hours ago     Up 24 hours     0.0.0.0:3030->3000/tcp, :::3030->3000/tcp                                              grafana
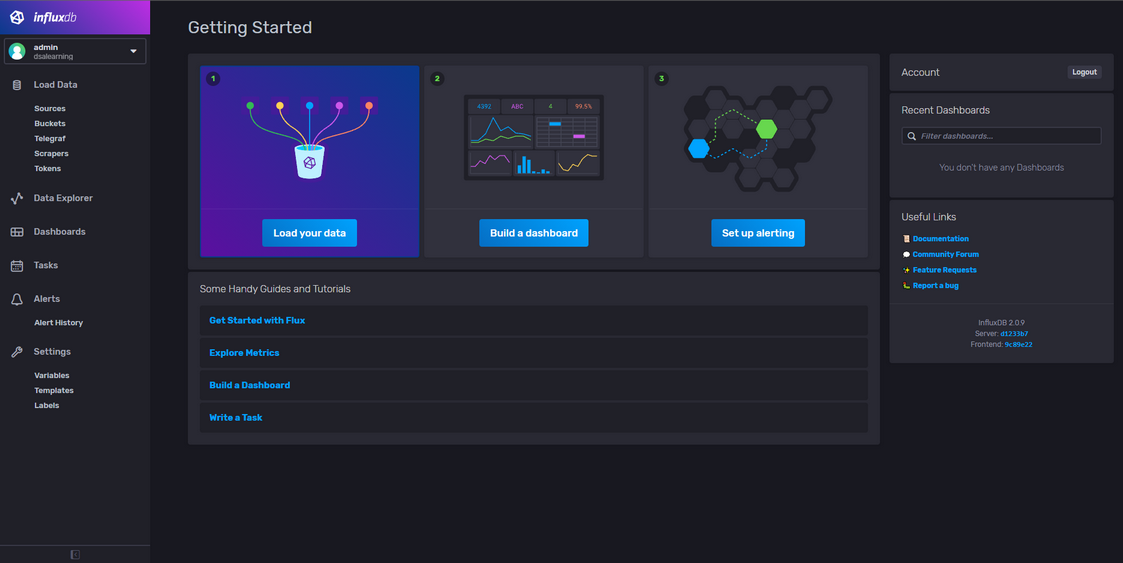
上述建立的 Grafana 與 Influxdb 這二個 Container 都有正常啟動,開啟瀏覽器連進 Influxdb 的入口頁面了,連結為 http://IP:8086,例如我剛才安裝的主機 IP 是 192.168.1.105,所以輸入 http://192.168.1.105:8086 即可。
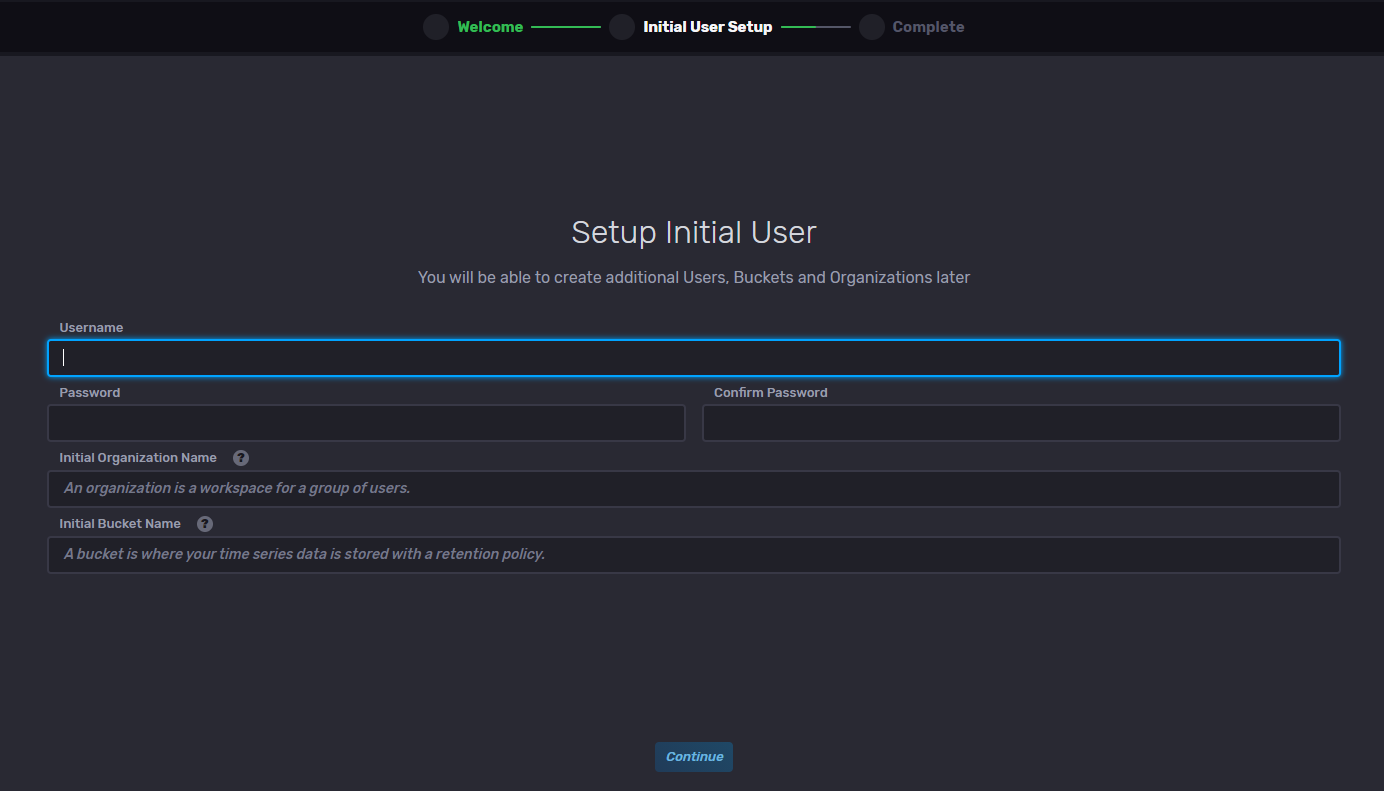
在建立 Container 時,就有設定 admin 的帳密,輸入後就可以看到下列畫面。
如果沒有設定 DOCKER_INFLUXDB_INIT 的這些參數也沒關係,進到入口頁面時,也可以依指示設定的。
安裝 Telegraf v1.20.2
Telegraf 是用來收集資料並傳送給 Influxdb,主要有兩個檔,分別是 telegraf.exe 與 telegraf.conf,下載可至官方,留意各平台的執行檔與設定檔是不同的,筆者試了下列二個平台都能正常的收集。
Linux
由於安裝的是 Influxdb v2.0 ,所以從官方下載下來的 telegraf.conf 需要再手動修改,可以參考Manually configure Telegraf。
如果不是用 docker 方式,可以參考官方的 Install Telegraf,下面筆者用 docker 建立出 telegraf 的 container,指令如下。
下載 telegraf.conf,這個檔案最好放在指定的路徑,因為建立 container 時,會 volumn 這個檔案,這樣只要在本機修改 config 檔即可。
$ docker run --rm telegraf telegraf config > telegraf.conf
下載後,編輯這個檔案,指令如下。
$ nano telegraf.conf
如果你熟悉其它編輯工具也可以,如 vi。
找到 [[outputs.influxdb]],修改為 [[outputs.influxdb_v2]],並維護下列四個變數,例如:
[[outputs.influxdb_v2]]
  urls = ["http://influxdb:8086"]
  token = "$INFLUX_TOKEN"
  organization = "dsalearning"
  bucket = "dsa-bucket"
這些變數都是我們在建立 influxdb 這個 container 時,都有設定了,除了 token。筆者是直接到 Influxdb 入口取得,如上述的 http://192.168.1.105:8086,在 Load Data –> Tokens –> dsaadmin's Token 。
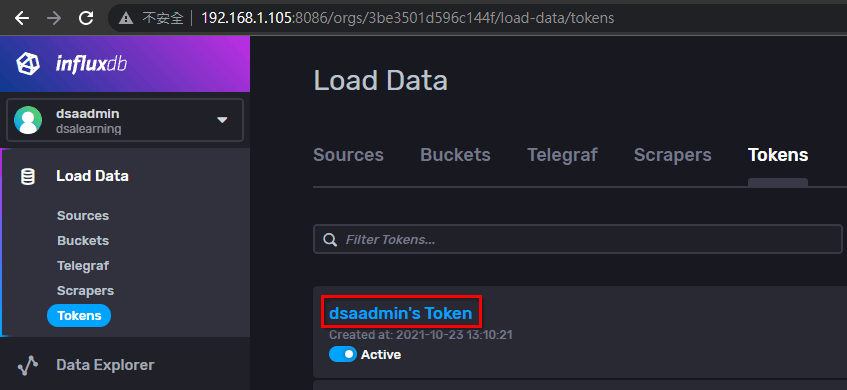
不過後來筆者發現,telegraf.conf 這個設定檔也可以直接在 Influxdb 入口取得,在 Load Data –> Telegraf –> Create Configuration,這之後筆者再另篇分享,筆者完整的 telegraf.conf內容如下。
# Configuration for telegraf agent
[agent]
  ## Default data collection interval for all inputs
  interval = "10s"
  ## Rounds collection interval to 'interval'
  ## ie, if interval="10s" then always collect on :00, :10, :20, etc.
  round_interval = true

  ## Telegraf will send metrics to outputs in batches of at most
  ## metric_batch_size metrics.
  ## This controls the size of writes that Telegraf sends to output plugins.
  metric_batch_size = 1000

  ## For failed writes, telegraf will cache metric_buffer_limit metrics for each
  ## output, and will flush this buffer on a successful write. Oldest metrics
  ## are dropped first when this buffer fills.
  ## This buffer only fills when writes fail to output plugin(s).
  metric_buffer_limit = 10000

  ## Collection jitter is used to jitter the collection by a random amount.
  ## Each plugin will sleep for a random time within jitter before collecting.
  ## This can be used to avoid many plugins querying things like sysfs at the
  ## same time, which can have a measurable effect on the system.
  collection_jitter = "0s"

  ## Default flushing interval for all outputs. Maximum flush_interval will be
  ## flush_interval + flush_jitter
  flush_interval = "10s"
  ## Jitter the flush interval by a random amount. This is primarily to avoid
  ## large write spikes for users running a large number of telegraf instances.
  ## ie, a jitter of 5s and interval 10s means flushes will happen every 10-15s
  flush_jitter = "0s"

  ## By default or when set to "0s", precision will be set to the same
  ## timestamp order as the collection interval, with the maximum being 1s.
  ##   ie, when interval = "10s", precision will be "1s"
  ##       when interval = "250ms", precision will be "1ms"
  ## Precision will NOT be used for service inputs. It is up to each individual
  ## service input to set the timestamp at the appropriate precision.
  ## Valid time units are "ns", "us" (or "µs"), "ms", "s".
  precision = ""

  ## Logging configuration:
  ## Run telegraf with debug log messages.
  debug = false
  ## Run telegraf in quiet mode (error log messages only).
  quiet = false
  ## Specify the log file name. The empty string means to log to stderr.
  logfile = ""

  ## Override default hostname, if empty use os.Hostname()
  hostname = ""
  ## If set to true, do no set the "host" tag in the telegraf agent.
  omit_hostname = false
[[outputs.influxdb_v2]]
  ## The URLs of the InfluxDB cluster nodes.
  ##
  ## Multiple URLs can be specified for a single cluster, only ONE of the
  ## urls will be written to each interval.
  ## urls exp: http://127.0.0.1:8086
  urls = ["http://192.168.1.105:8086"]

  ## Token for authentication.
  token = "$INFLUX_TOKEN"

  ## Organization is the name of the organization you wish to write to; must exist.
  organization = "dsalearning"

  ## Destination bucket to write into.
  bucket = "dsa-bucket"
[[inputs.cpu]]
  ## Whether to report per-cpu stats or not
  percpu = true
  ## Whether to report total system cpu stats or not
  totalcpu = true
  ## If true, collect raw CPU time metrics.
  collect_cpu_time = false
  ## If true, compute and report the sum of all non-idle CPU states.
  report_active = false
[[inputs.disk]]
  ## By default stats will be gathered for all mount points.
  ## Set mount_points will restrict the stats to only the specified mount points.
  # mount_points = ["/"]
  ## Ignore mount points by filesystem type.
  ignore_fs = ["tmpfs", "devtmpfs", "devfs", "overlay", "aufs", "squashfs"]
[[inputs.diskio]]
[[inputs.mem]]
[[inputs.net]]
[[inputs.processes]]
[[inputs.swap]]
[[inputs.system]]
[[inputs.docker]]
  ## Docker Endpoint
  ##   To use TCP, set endpoint = "tcp://[ip]:[port]"
  ##   To use environment variables (ie, docker-machine), set endpoint = "ENV"
  ##   exp: unix:///var/run/docker.sock
  endpoint = "unix:///var/run/docker.sock"

  ## Set to true to collect Swarm metrics(desired_replicas, running_replicas)
  gather_services = false

  ## Only collect metrics for these containers, collect all if empty
  container_names = []

  ## Containers to include and exclude. Globs accepted.
  ## Note that an empty array for both will include all containers
  container_name_include = []
  container_name_exclude = []

  ## Container states to include and exclude. Globs accepted.
  ## When empty only containers in the "running" state will be captured.
  # container_state_include = []
  # container_state_exclude = []

  ## Timeout for docker list, info, and stats commands
  timeout = "5s"

  ## Whether to report for each container per-device blkio (8:0, 8:1...) and
  ## network (eth0, eth1, ...) stats or not
  perdevice = true

  ## Whether to report for each container total blkio and network stats or not
  total = false

  ## Which environment variables should we use as a tag
  ##tag_env = ["JAVA_HOME", "HEAP_SIZE"]
  ## docker labels to include and exclude as tags.  Globs accepted.
  ## Note that an empty array for both will include all labels as tags
  docker_label_include = []
  docker_label_exclude = []
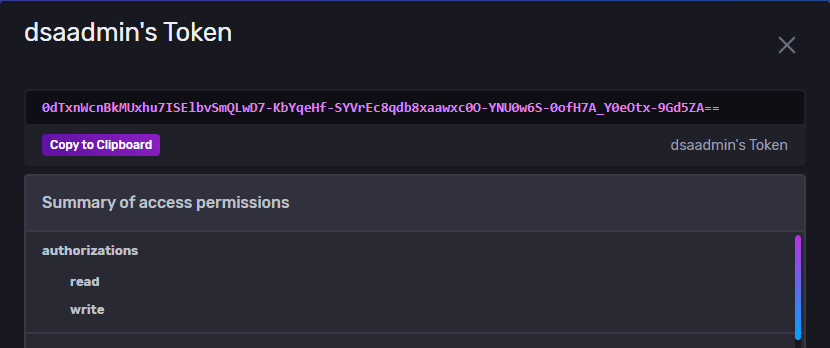
telegraf.conf 編輯好後, export INFLUX_TOKEN 值,參考圖 dsaadmin’s token(一)與(二),不要直接複製下文範例。
建立 telegraf 指令如下。
$ docker run -d --name=telegraf \
      --net=influxdb \
      -v /var/run/docker.sock:/var/run/docker.sock \
      -v $PWD/telegraf.conf:/etc/telegraf/telegraf.conf:ro \
      -e INFLUX_TOKEN=0dTxnWcnBkMUxhu7ISElbvSmQLwD7-KbYqeHf-SYVrEc8qdb8xaawxc0O-YNU0w6S-0ofH7A_Y0eOtx-9Gd5ZA== \
      telegraf
這步驟很有可能在 token 這地方出錯,可用下列指令檢查。
$ docker logs -f telegraf
如果是 token 錯誤,會得到 401 Unauthorized,結果如下。
$ docker logs telegraf -f
2021-10-23T05:37:52Z I! Starting Telegraf 1.20.2
2021-10-23T05:37:52Z I! Using config file: /etc/telegraf/telegraf.conf
2021-10-23T05:37:52Z I! Loaded inputs: cpu disk diskio docker mem net processes swap system
2021-10-23T05:37:52Z I! Loaded aggregators:
2021-10-23T05:37:52Z I! Loaded processors:
2021-10-23T05:37:52Z I! Loaded outputs: influxdb_v2
2021-10-23T05:37:52Z I! Tags enabled: host=499cfb7b6dd9
2021-10-23T05:37:52Z I! [agent] Config: Interval:10s, Quiet:false, Hostname:"499cfb7b6dd9", Flush Interval:10s
2021-10-23T05:37:52Z W! [inputs.docker] 'perdevice' setting is set to 'true' so 'blkio' and 'network' metrics will be collected. Please set it to 'false' and use 'perdevice_include' instead to control this behaviour as 'perdevice' will be deprecated
2021-10-23T05:38:02Z E! [outputs.influxdb_v2] When writing to [http://influxdb:8086]: failed to write metric (401 Unauthorized): unauthorized: unauthorized access
2021-10-23T05:38:02Z E! [agent] Error writing to outputs.influxdb_v2: failed to write metric (401 Unauthorized): unauthorized: unauthorized access
只要把 Token 填正確, telegraf 就能正常收集資料儲在在 influxdb 了。
Windows
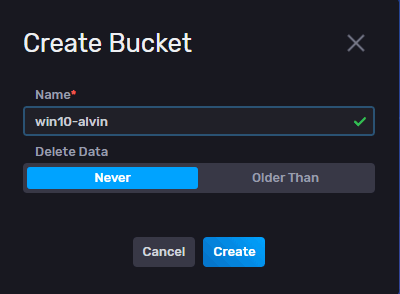
這裡筆者在 Influxdb 建立另一個 bucket 來存放,這個 bucket 命名為 win10-alvin。
在 windows 設定 telegraf 請參考Run Telegraf as a Windows service,這裡就依這篇設定。
** 注意 **:開啟 PowerShell 務必以系統管理員身份執行,否則會出現下列錯誤。
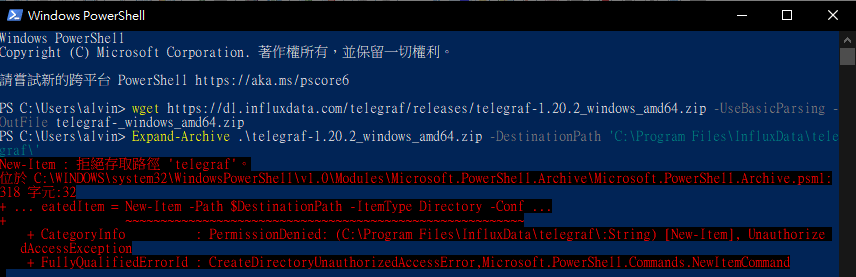
首先以系統管理員身份開啟 PowerShell,執行指令如下。
> wget https://dl.influxdata.com/telegraf/releases/telegraf-1.20.2_windows_amd64.zip -UseBasicParsing -OutFile telegraf-_windows_amd64.zip
> Expand-Archive .\telegraf-_windows_amd64.zip -DestinationPath 'C:\Program Files\InfluxData\telegraf\'
這時檔案會被解壓縮到 C:\Program Files\InfluxData\telegraf\telegraf-1.20.2 這個路徑,需要把裡面的檔案複製到 C:\Program Files\InfluxData\telegraf\,指令如下。
> cd "C:\Program Files\InfluxData\telegraf"
> mv .\telegraf-1.20.2\telegraf.* .
這時務必要修改 telegraf.conf,同 Linxu 版一樣,再複習一次吧。
[[outputs.influxdb_v2]]
  urls = ["http://192.168.1.105:8086"]
  token = "直接把 Token 貼進來"
  organization = "dsalearning"
  bucket = "win10-alvin"
這裡使用的 bucket 是剛才建立的,是不同與 Linux 用的 dsa-bucket喔。
把 telegraf.exe 安裝成 Windows 的服務吧,指令如下。
> .\telegraf.exe --service install --config "C:\Program Files\InfluxData\telegraf\telegraf.conf"
啟動此服務,指令如下。
> .telegraf.exe --service start
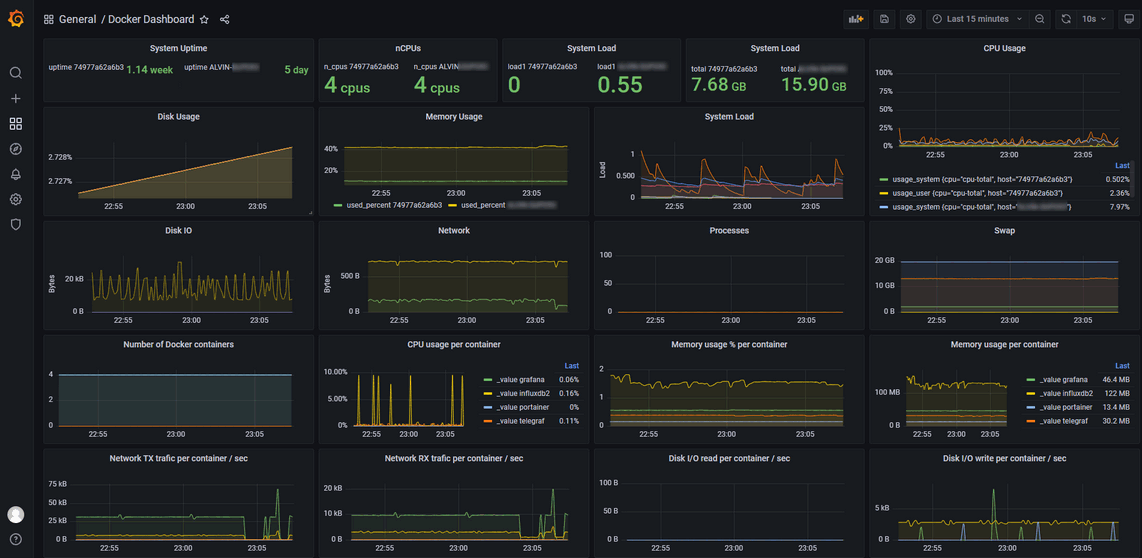
Dashboard
下圖是筆者用 influxdb 的 template 建立的 dashboard,再用這個 template 來建立 Grafana 版的 Dashboard。
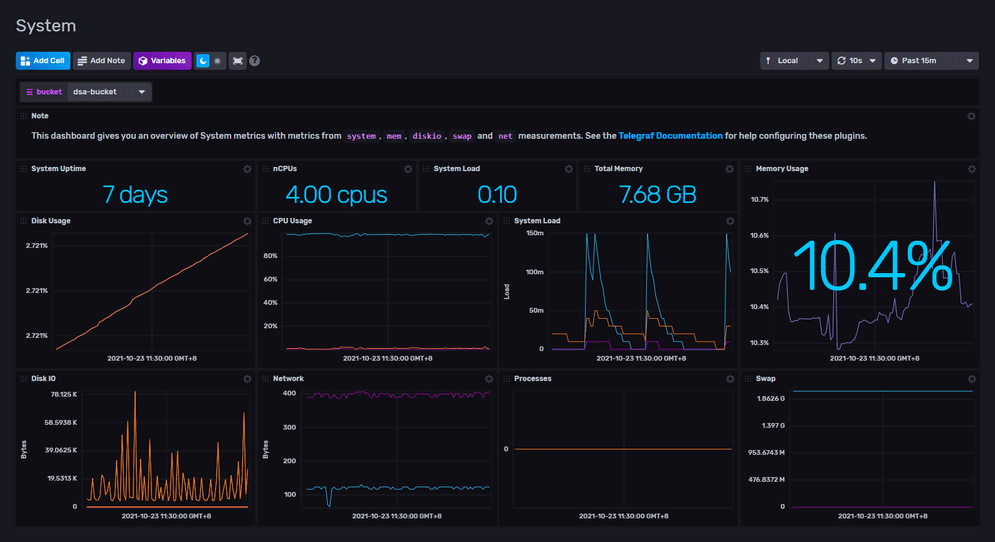
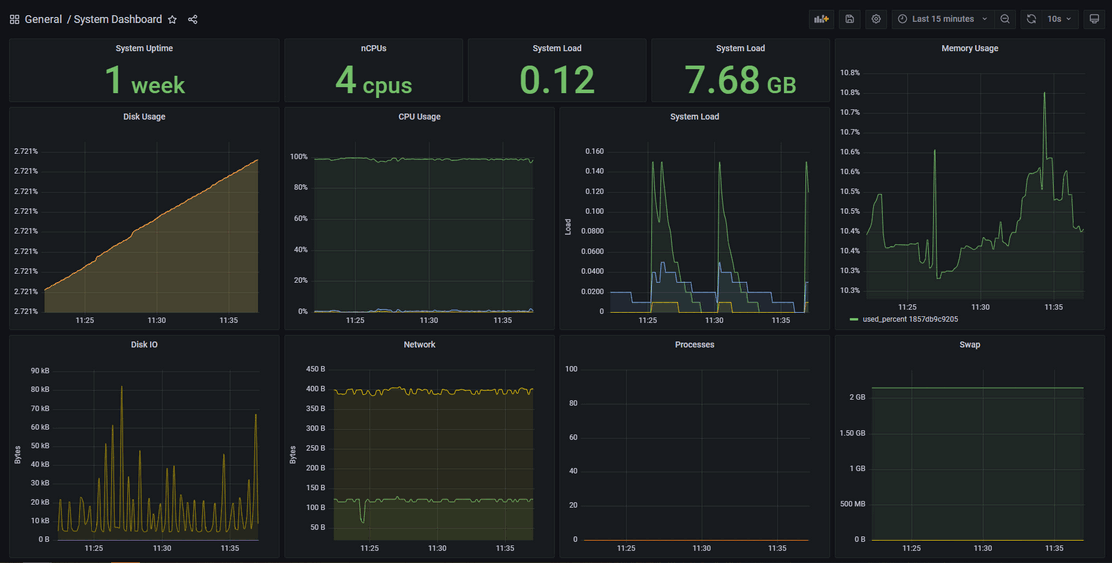
如何做出這樣的 Dashboard ,筆者另篇分享。

留言