
MSSQL-如何查出誰用掉 Tempdb 的空間?
甘苦談
撰寫 SQL 時,對於建立暫存表(Temp Table)一定不陌生,而這個暫存表使用的資料庫就是系統庫的 tempdb ,在資料倉儲(Data Warehouse)或大型資料庫常常因 tempdb 不當使用而造成效能的瓶頸,甚至把 tempdb 所在的磁碟空間耗盡,這時原本一個查詢只要幾秒鐘都可能變成幾小時,所以大家在使用臨時表時,務必有良好的習慣,程序結束不用時,就主動的釋放吧,雖然連線斷掉時,系統也會回收,但當連線數很多時呢?系統資源不夠好的情況下,這些都將成為效能的殺手。
筆者在運維資料倉儲時,也就常遇到這樣的情況,這時你會很想知道是誰把 tempdb 空間用掉了,查詢 tempdb 的空間使用,主要是從系統提供的 DMV(Dynamic Management Views) 之一的 sys.dm_db_session_space_usage 查詢得知,透過這個 DMV 就可以快速定位到問題,但前題是該連線還沒有 Close 掉。
注意 此視圖只適用于 tempdb 資料庫。
此 DMV 的欄位說明如下:
| 資料行名稱 | 資料類型 | 描述 |
|---|---|---|
| session_id | smallint | 工作階段識別碼。 session_id對應至sys. dm_exec_sessions中的session_id 。 |
| database_id | smallint | 資料庫識別碼。 |
| user_objects_alloc_page_count | bigint | 這個工作階段所保留或配置給使用者物件的頁數。 |
| user_objects_dealloc_page_count | bigint | 這個工作階段已取消配置且不再保留給使用者物件的頁數。 |
| internal_objects_alloc_page_count | bigint | 這個工作階段所保留或配置給內部物件的頁數。 |
| internal_objects_dealloc_page_count | bigint | 這個工作階段已取消配置且不再保留給內部物件的頁數。 |
| user_objects_deferred_dealloc_page_count | bigint | 已標示為延後解除配置的頁面數目。 注意: 在和的 service pack 中引進 SQL Server 2012 (11.x) SQL Server 2014 (12.x) 。 |
| pdw_node_id | int | 適用于: Azure Synapse Analytics (SQL 資料倉儲) 、 平行處理資料倉儲 此散發所在之節點的識別碼。 |
範例
這個範例是每一秒把 AdventureWorksDW2008R2.dbo.FactResellerSales 的資料滙入到暫存表,共匯入 100 次。再用系統的這個 DMV 查詢。
-
#1 建立一個新的查詢視窗,把下文的語句貼入。這時請你記得這個查詢視窗的 SPID 是多少。
use AlvinDB
GO

--建立空表
select *
into #tmpFactResellerSales
from AdventureWorksDW2008R2.dbo.FactResellerSales
where 1=2;

declare @i int;
set @i=0;
--塞入測試資料
while @i<100
begin
  WAITFOR DELAY '00:00:01';

  insert into #tmpFactResellerSales(
    ProductKey,OrderDateKey,DueDateKey,ShipDateKey
    ,ResellerKey,EmployeeKey,PromotionKey,CurrencyKey
    ,SalesTerritoryKey,SalesOrderNumber,SalesOrderLineNumber
    ,RevisionNumber,OrderQuantity,UnitPrice,ExtendedAmount
    ,UnitPriceDiscountPct,DiscountAmount,ProductStandardCost
    ,TotalProductCost,SalesAmount,TaxAmt,Freight
    ,CarrierTrackingNumber,CustomerPONumber
  )
  select
    ProductKey,OrderDateKey,DueDateKey,ShipDateKey
    ,ResellerKey,EmployeeKey,PromotionKey,CurrencyKey
    ,SalesTerritoryKey,SalesOrderNumber,SalesOrderLineNumber
    ,RevisionNumber,OrderQuantity,UnitPrice,ExtendedAmount
    ,UnitPriceDiscountPct,DiscountAmount,ProductStandardCost
    ,TotalProductCost,SalesAmount,TaxAmt,Freight
    ,CarrierTrackingNumber,CustomerPONumber
  from AdventureWorksDW2008R2.dbo.FactResellerSales
  where 1=1

  set @i=@i+1;
end

--保持好習慣,不用就釋放
if object_id('tempdb..#tmpFactResellerSales') is not null
  drop table #tmpFactResellerSales;
這時請勿關閉連線,但可以把暫存表給釋放了。
-
#2 再建立另一個查詢視窗,執行下列語句。
select *
from sys.dm_db_session_space_usage
where 1=1
order by user_objects_alloc_page_count desc ;
在 #1 時,筆者的 SPID 是
91,結果如下圖。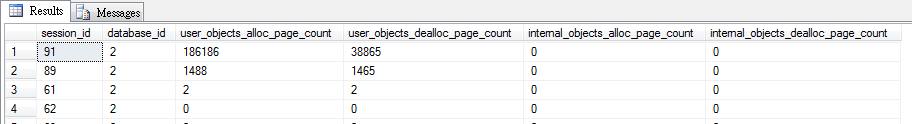
這時你會覺得,只知道是哪一個程序耗用了 tempdb 空間,但不知道其執行的語句,以筆者的習慣是使用 MSSQL Performance Report 去查詢。
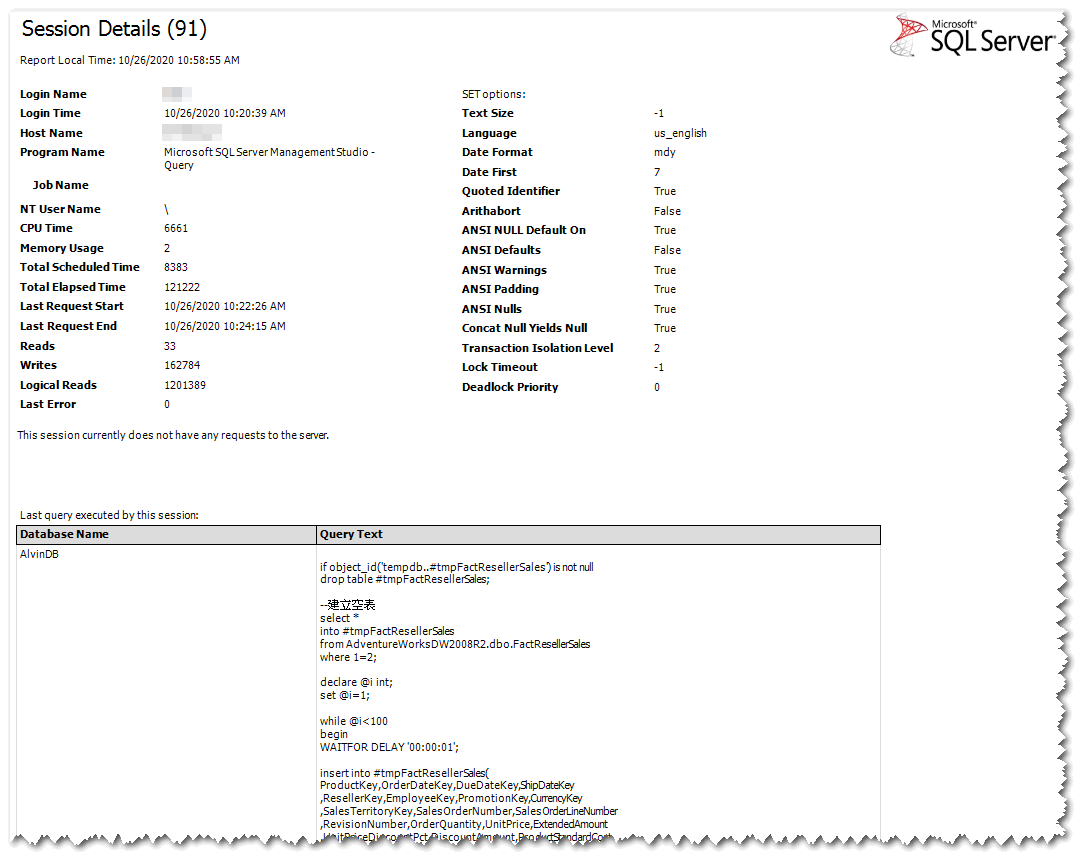
或者可以直接串其它的 DMV 得知查詢語句。
SELECT
  a.session_id,a.login_name, a.host_name, a.program_name
  , e.[text]
  , b.user_objects_alloc_page_count
  , b.user_objects_dealloc_page_count
  , b.internal_objects_alloc_page_count
  , b.internal_objects_dealloc_page_count
  , c.last_read, c.last_write
FROM sys.dm_exec_sessions as a
INNER JOIN sys.dm_db_session_space_usage as b
  ON b.session_id = a.session_id
LEFT OUTER JOIN sys.dm_exec_connections as c
  ON b.session_id = c.most_recent_session_id
OUTER APPLY sys.dm_exec_sql_text(c.most_recent_sql_handle) as e
WHERE b.session_id > 50 --50以內是系統執行緒
order by b.user_objects_alloc_page_count desc ;
結果如下


結語
有時常發現,上次執行都好好的,也沒有改程式,怎麼變慢了!變慢的原因有很多種,像資料量變大、網路塞、磁碟回應時間慢、有表鎖定、…等等,而 tempdb 異常也是會導致查詢變慢,本篇只是勸告撰寫 SQL 時,請留意暫存表的使用,用完就釋放,不要留給系統的機制去回收,希望本篇對你有幫助。

留言